
TraLIS's BI module transforms your operational data into actionable performance indicators. Configurable dashboards, real-time per-file margin, gross revenue by client and mode, and exportable reports for your management reviews — without leaving TraLIS.
What you can do
Real-time KPI dashboard
View your key indicators at a glance: active files, month revenue, average margin, collection rate. Figures update continuously.
Per-file margin
Every file shows its profitability: gross revenue, direct costs (freight, handling, subcontractors), and net margin. Immediately spot underperforming files.
Analysis by client & mode
Compare the profitability of your clients, transport modes, and destinations. Focus your commercial development on the most profitable segments.
Exportable reports
Generate monthly, quarterly, or annual reports in PDF or Excel. Share data with management, partners, or your accountant.
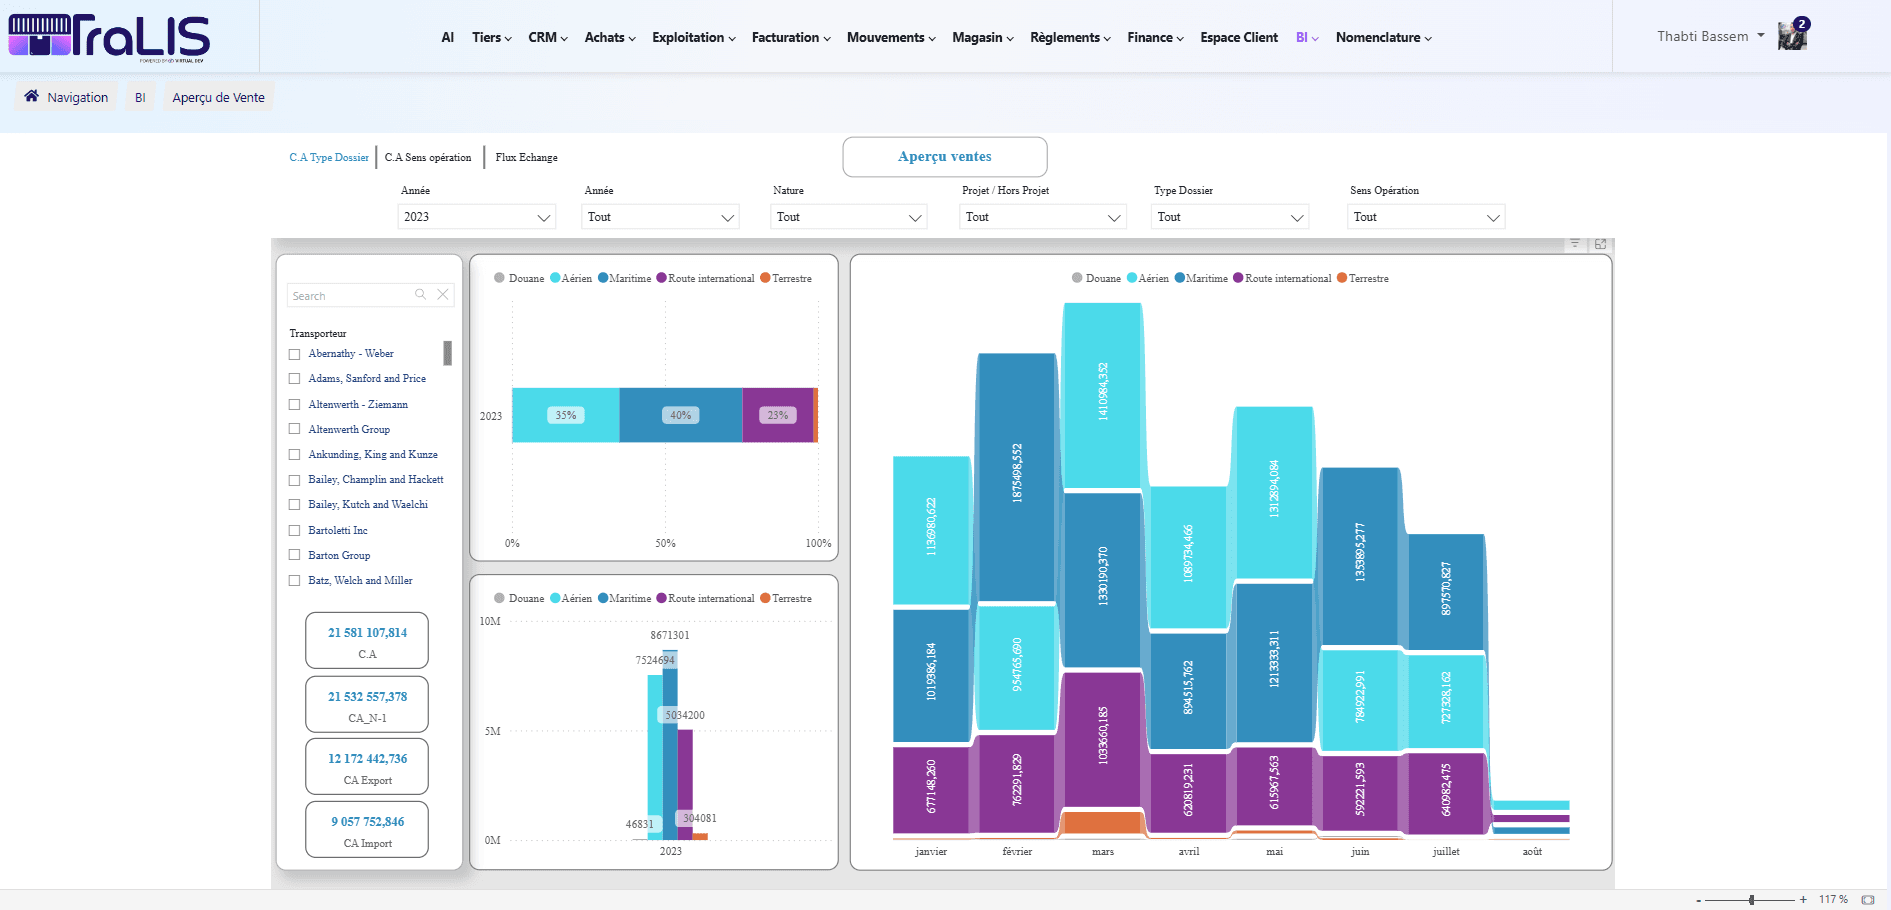
Monthly performance review in 15 minutes
Your CEO asks for a month summary. You open TraLIS's BI dashboard: month revenue, comparison with previous month, top 5 clients by margin, invoiced file rate. You filter by sea mode — you see that the average margin has dropped 3 points. You export the report as PDF and send the file. Meeting in 10 minutes, you're ready.
Sectors using this module
Want to see Freight Analytics & Reporting in action?
We prepare a focused demo on this module, in your business context.
Request a demo →